
Background
ThumbStopper is an AI-driven content management system that empowers major brands to market to their local retailer networks effectively. Initially, the platform allowed users to schedule content solely for Facebook. Our project aimed to expand its functionality to include Instagram, Google My Business, and Twitter. This multi-phase effort required not only introducing these new integrations but also refining the user experience to address key usability challenges and ensure retailers could maximize their content strategy.
Key objectives
· Introduce Multi-Platform Integration: Enable scheduling and management for Instagram, Google My Business, and Twitter alongside Facebook.
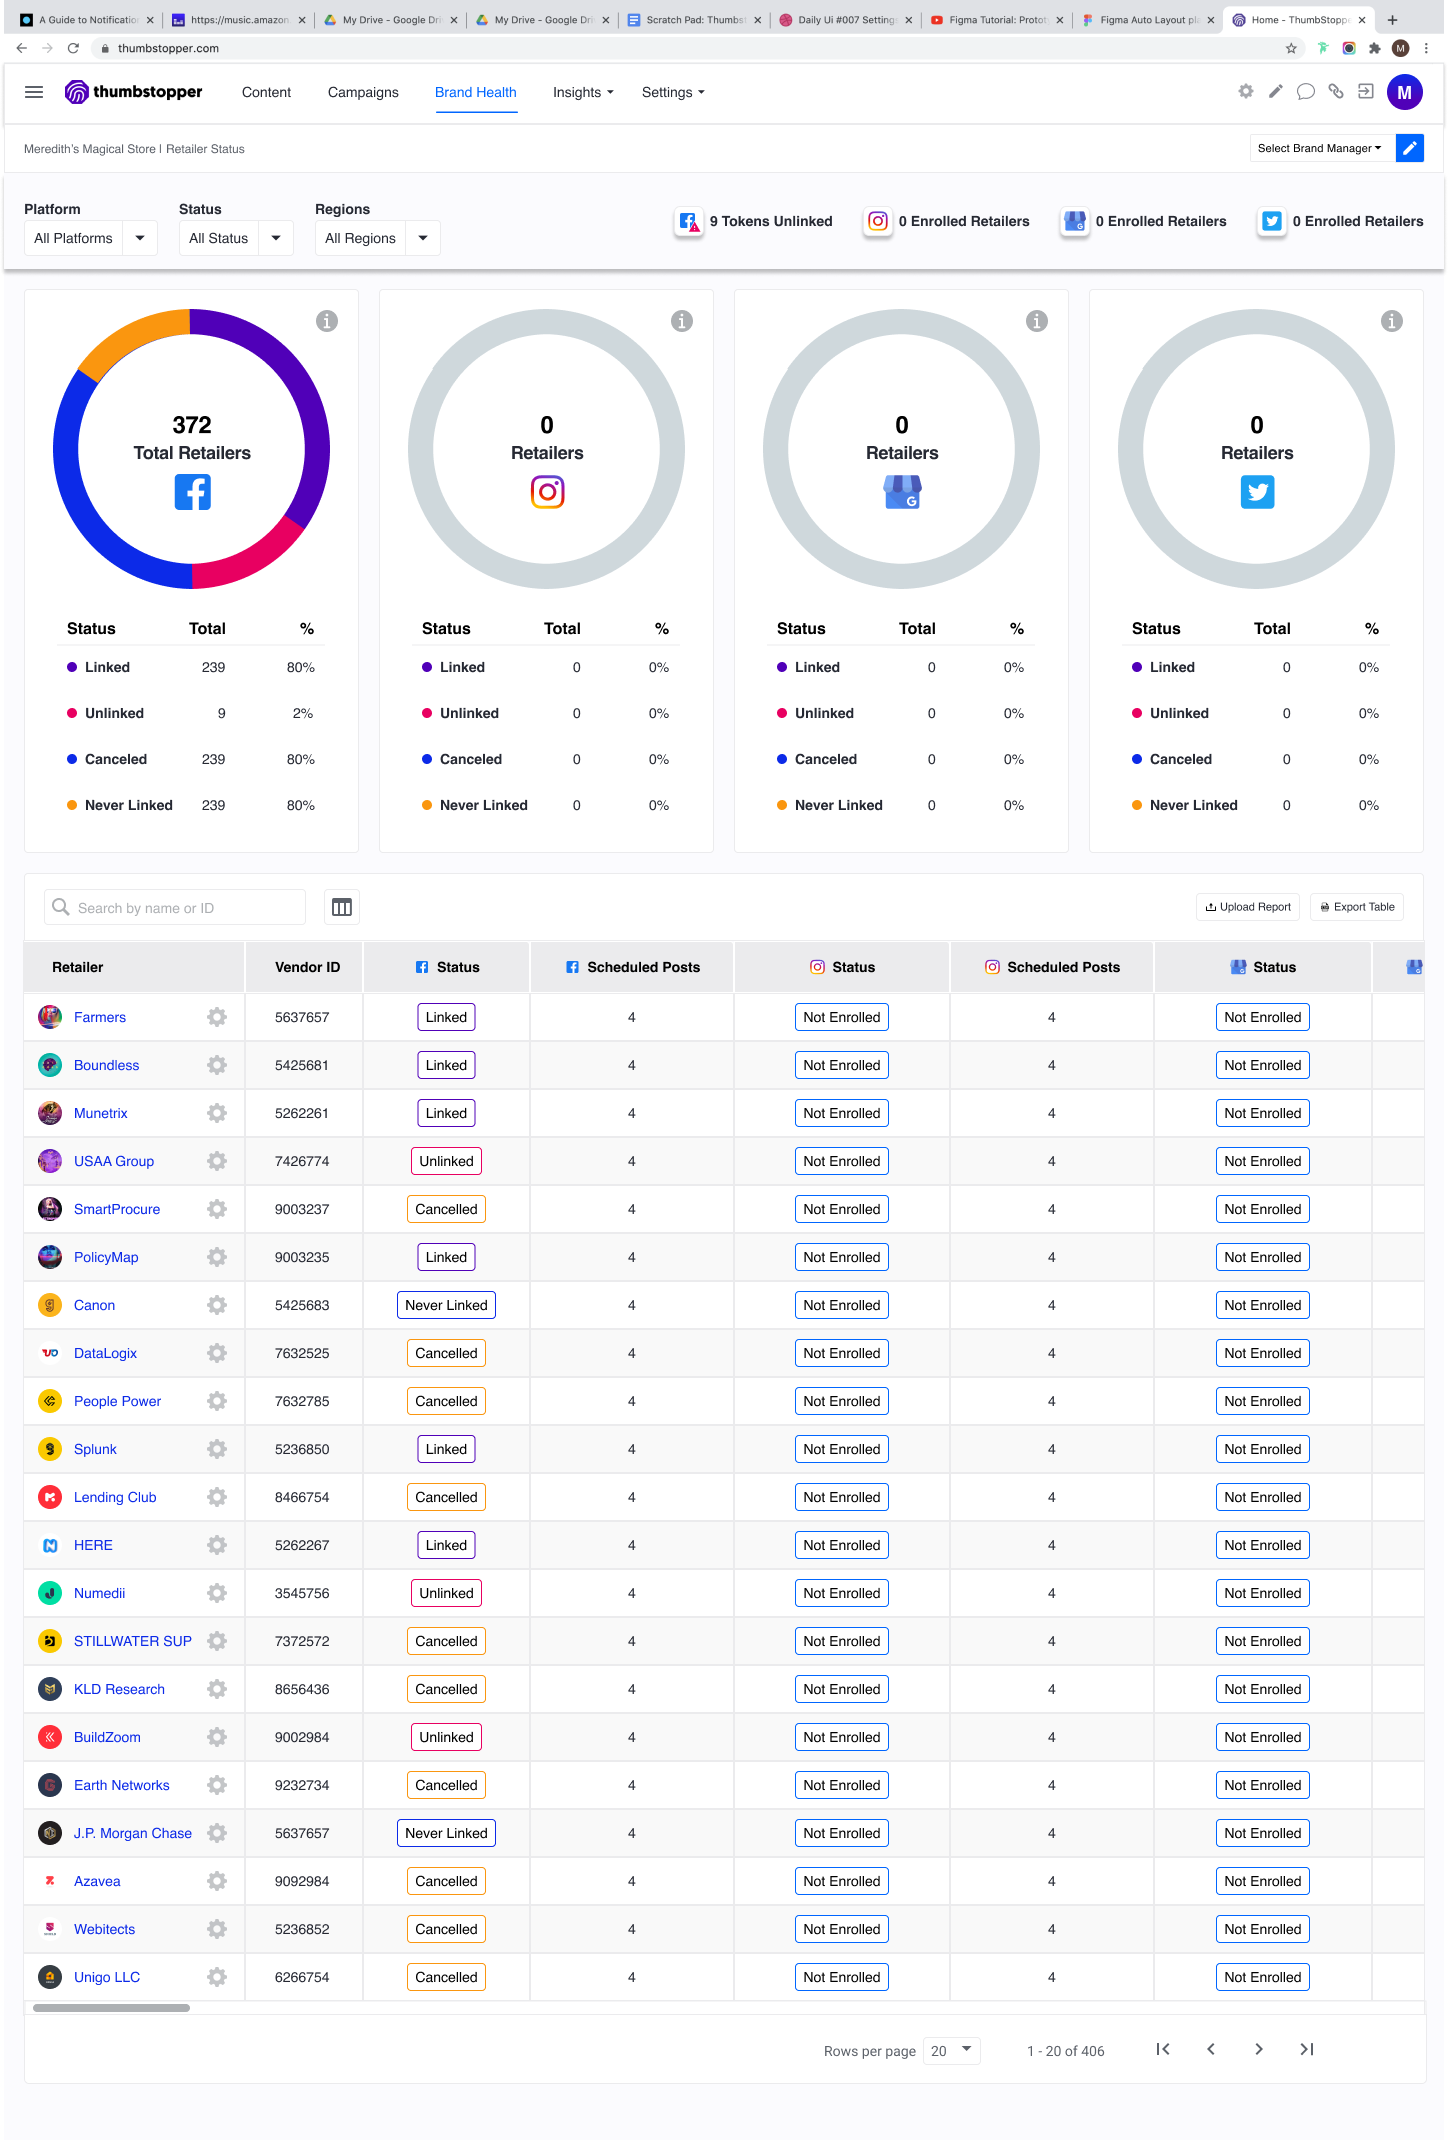
· Accurately Display Retailer Status: Provide clear, real-time insights into a retailer's publishing activity, engagement and API linked status.
· Improve Filters: Redesign filters to be more intuitive, enabling users to quickly find the content or retailers they need.
· Add Pre-Set Date Picker Options: Streamline scheduling workflows with commonly used date ranges and quicker navigation.
· Enhance Data Table Functionality: Improve data visualization and interactivity to make insights more actionable.
· Prevent Content Gaps: Design better data visualizations to alert retailers when they are running out of scheduled content.
The Process
Research and Discovery
We conducted interviews with users from major brands and local retailers to identify pain points in the existing CRM. Key findings included:
· Content Variety: Retailers needed more platforms to reach diverse audiences.
· Complex Filters: The existing filters were clunky and unintuitive, leading to frustration.
· Data Overload: Retailers struggled to interpret data tables, missing critical insights like content shortages.
Data Visualization wire-frames and prototypes
Based on these insights, we created wireframes and prototypes to visualize solutions:
· A multi-platform Brand Health dashboard for Facebook, Instagram, Google My Business, and Twitter, featuring key metrics presented through at-a-glance data visualizations. Designed for social media marketing managers, to ensure all of their retailers are connected and receiving content to maximize their marketing efforts.
· Redesigned filters with scalable patterns and pre-set dates that the user could apply in one-click.
· Enhanced data tables with sortable columns, tooltips, and dynamic visualizations like progress bars to indicate content availability.
Brand Health Worflows
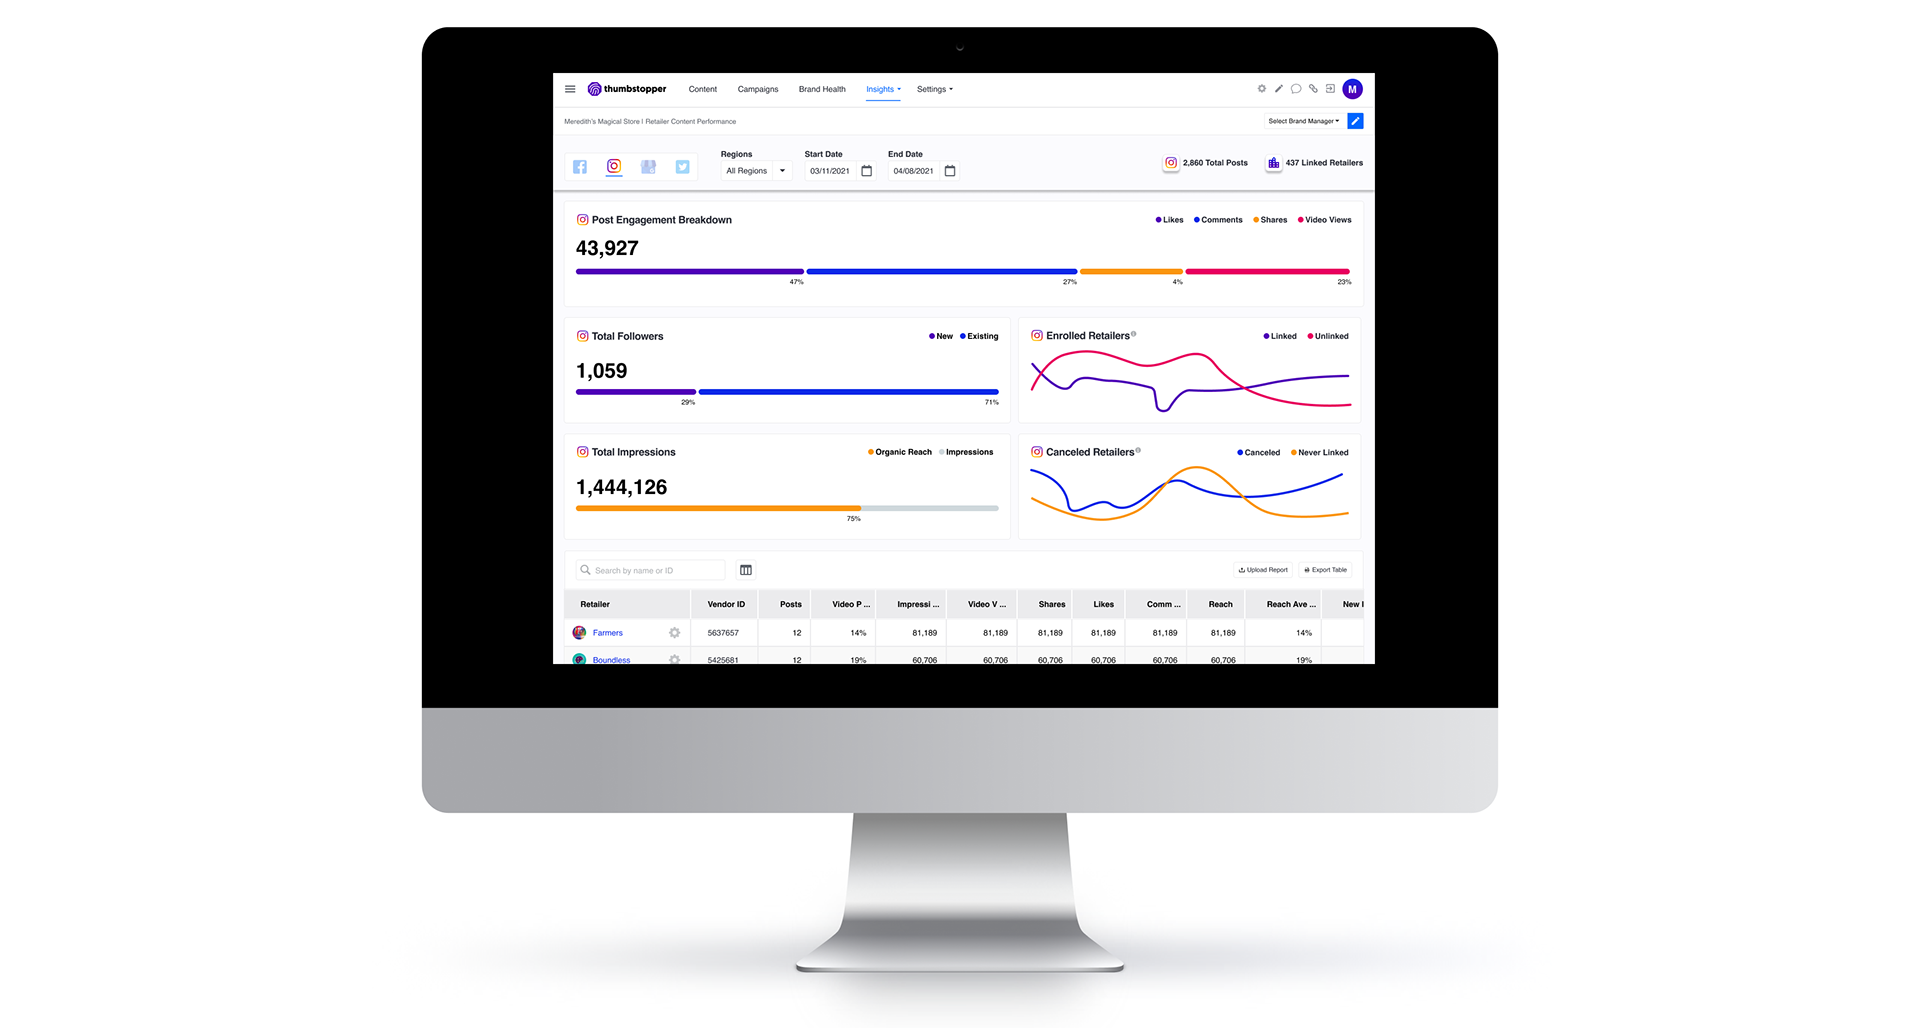
· The Retailer Performance dashboard addressed the need for detailed insights into retailer activity across platforms.
· The dashboard allows users to view performance metrics for each platform and drill down by region, specific states, and custom date ranges.
· This functionality empowers users to identify what’s working and what isn’t, enabling them to better strategize their digital marketing campaigns and optimize efforts for maximum impact.

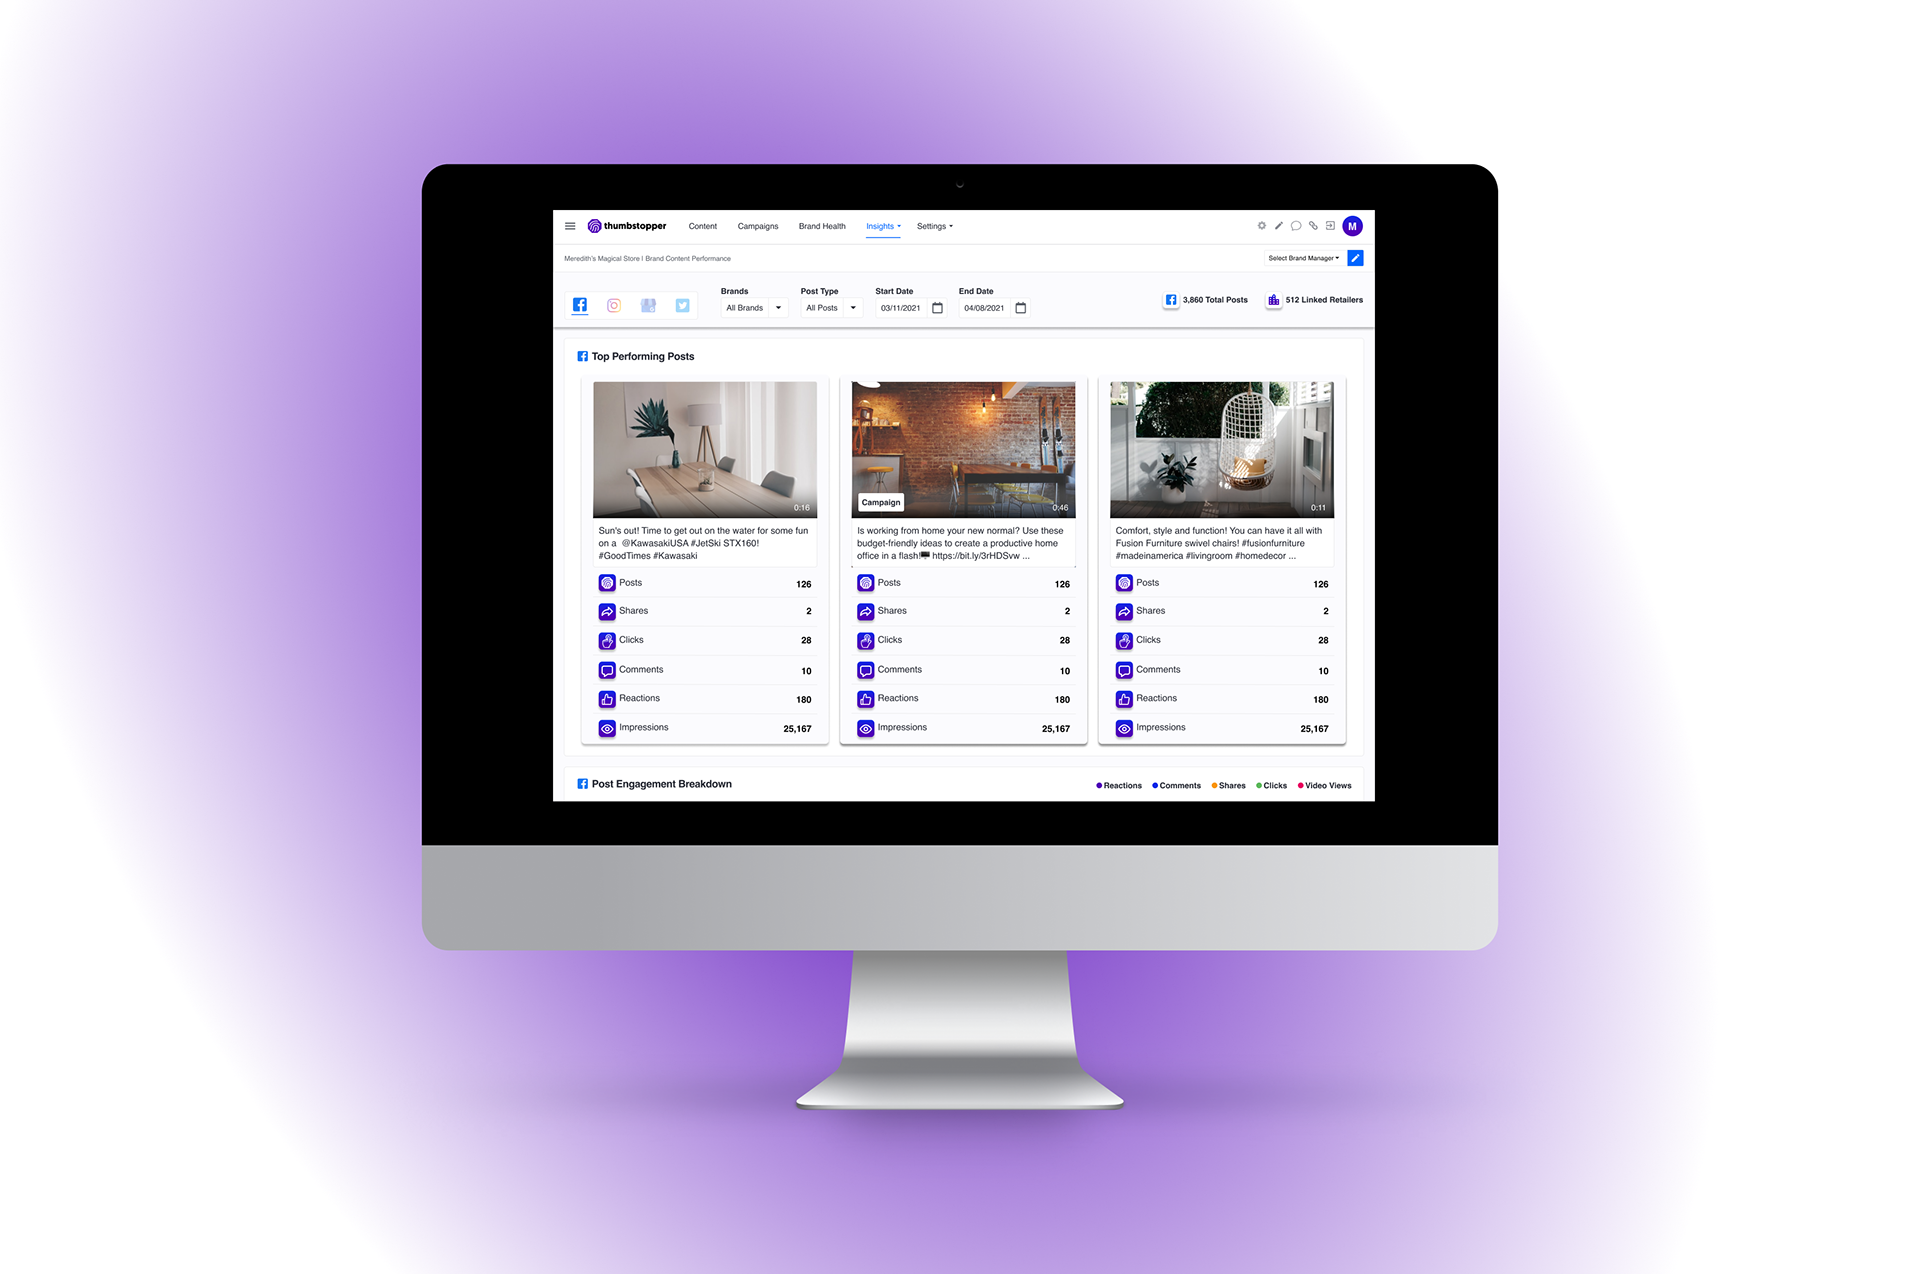
Multi-Platform Reporting Workflows
Social Media Marketing Managers needed a way to:
· Track their top-performing posts across platforms, analyze engagement trends
· Identify the most frequently posted products
· Access a detailed breakdown of product posts.
This insight ensures they can implement effective strategies on a global scale.
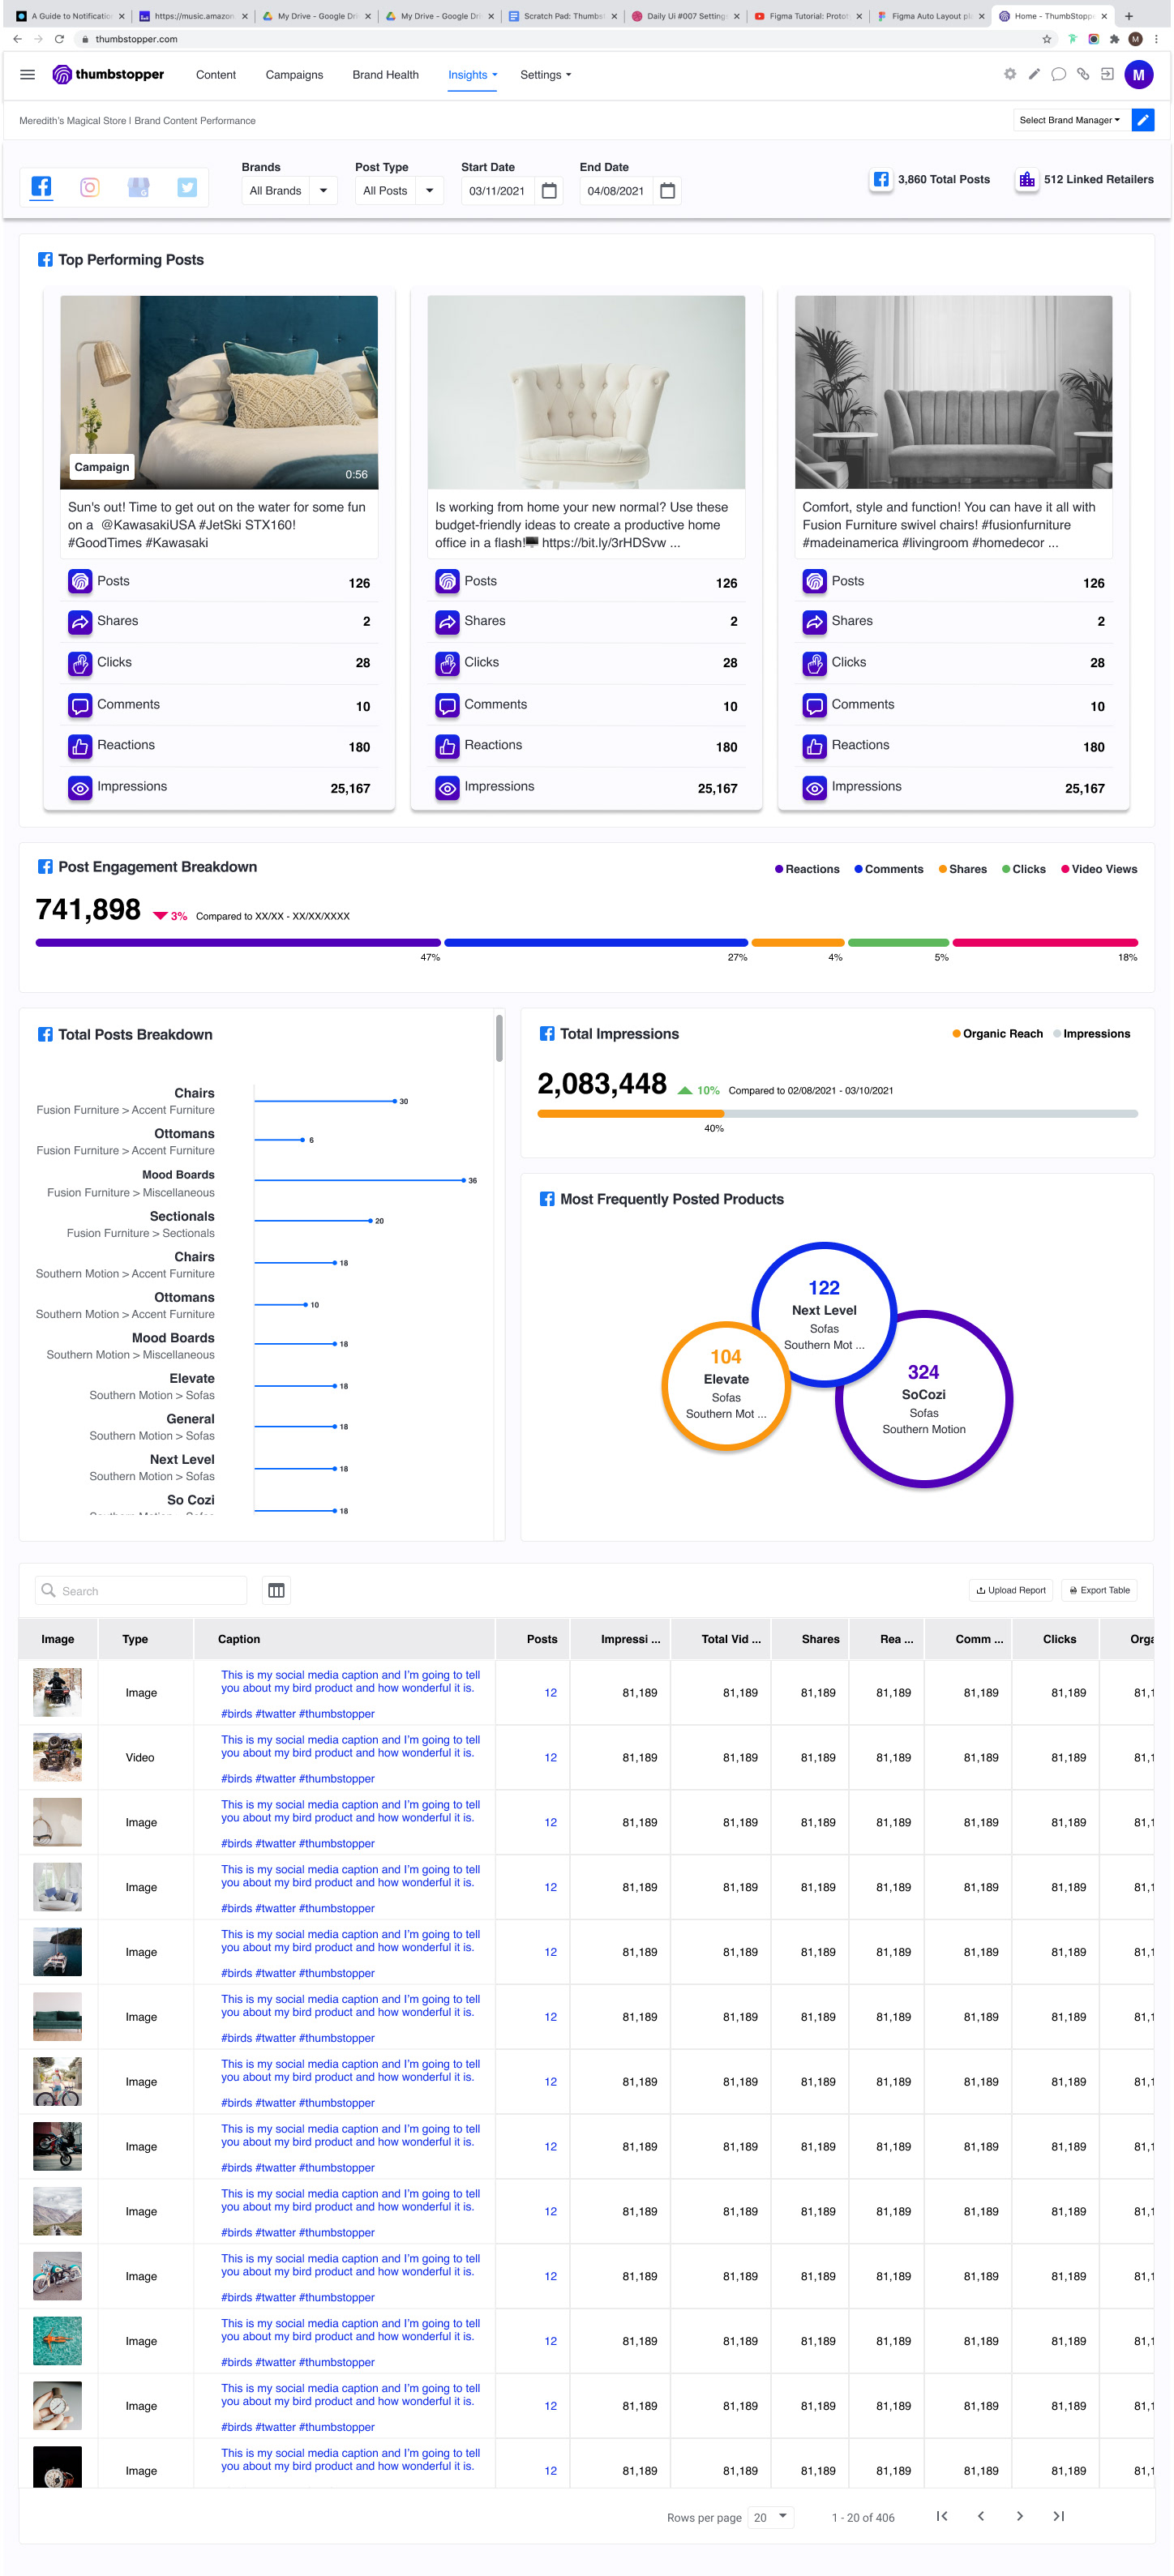
Brand Content Performance Workflows
The Outcome
The outcome of this project was to provide developers with a long-term vision informed by usability research conducted with key accounts. Our approach was to roll out features iteratively, starting with multi-platform posting. As each phase was released, we planned to refine and optimize based on user feedback and technical constraints, especially given our reliance on various vendors' APIs to access the necessary data. This iterative strategy ensured flexibility while maintaining alignment with user needs and system capabilities.